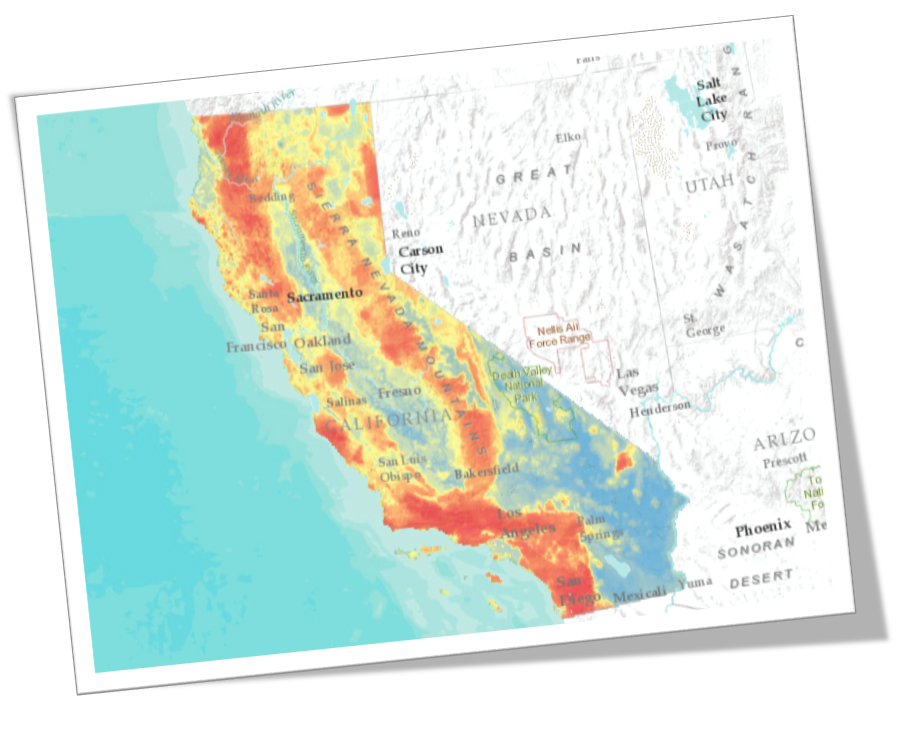
We’ve built the most accurate wildfire risk map for the US
Curious?
The US has been experiencing the worst wildfires in its recorded history recently. Recent wildfires in California has caused an insurance carrier and the power distribution company to file bankruptcy.
Only ~55% of areas that burned in the last 20 years is classified as High or Very High in US Forestry’s Wildfire Hazard Map. According to case-studies provided by largest modeling companies, models perform up to ~65% of accuracy in best cases.
Are you a Duck Creek client? You can visit our Partner website to learn more about our integrations.

UrbanStat’s Wildfire API provides more than a risk score:
Score: A score between 0-100 and its categorical risk level (Very High, High, Medium, etc.)
Probability: Long term probability of occurrence for each risk score.
History: Information regarding the historical wildfires affected the location.
Real-Time Alert: Information regarding short term risk levels related to near-term climatic trends, e.g. increasing temperatures, decreasing precipitation.
Traditional wildfire models uses 2-4 variables to predict wildfire risk. UrbanStat uses more than 30 variables.
Traditional Variables: Topography (includes Aspect, Slope etc.), Vegetation&Fuel, Access
UrbanStat Variables: Traditional variables + Historical Climate Data, Power Distribution Network, Landuse, Solar Radiation, Hydrology, Transportation Network, Drought, Historical Wildfire Events + 18 other variables.
Contrary to rule based scores, UrbanStat wildfire model identifies non-linear relationships between wildfires and variables. According to our findings based on our research on last 80 years of wildfires, Slope and many other variables may have completely different effects in different parts of the geography. UrbanStat uses a completely different approach to make sure that these type of differences are handled properly in scoring.